Reliability Engineering in Manufacturing: The Complete Guide to Maximizing Asset Uptime and Reducing Unplanned Failures
Everything manufacturing leaders need to know about reliability engineering — from foundational metrics like MTBF and MTTR to advanced disciplines including FRACAS, Weibull analysis, and RCM strategy.
John Lee
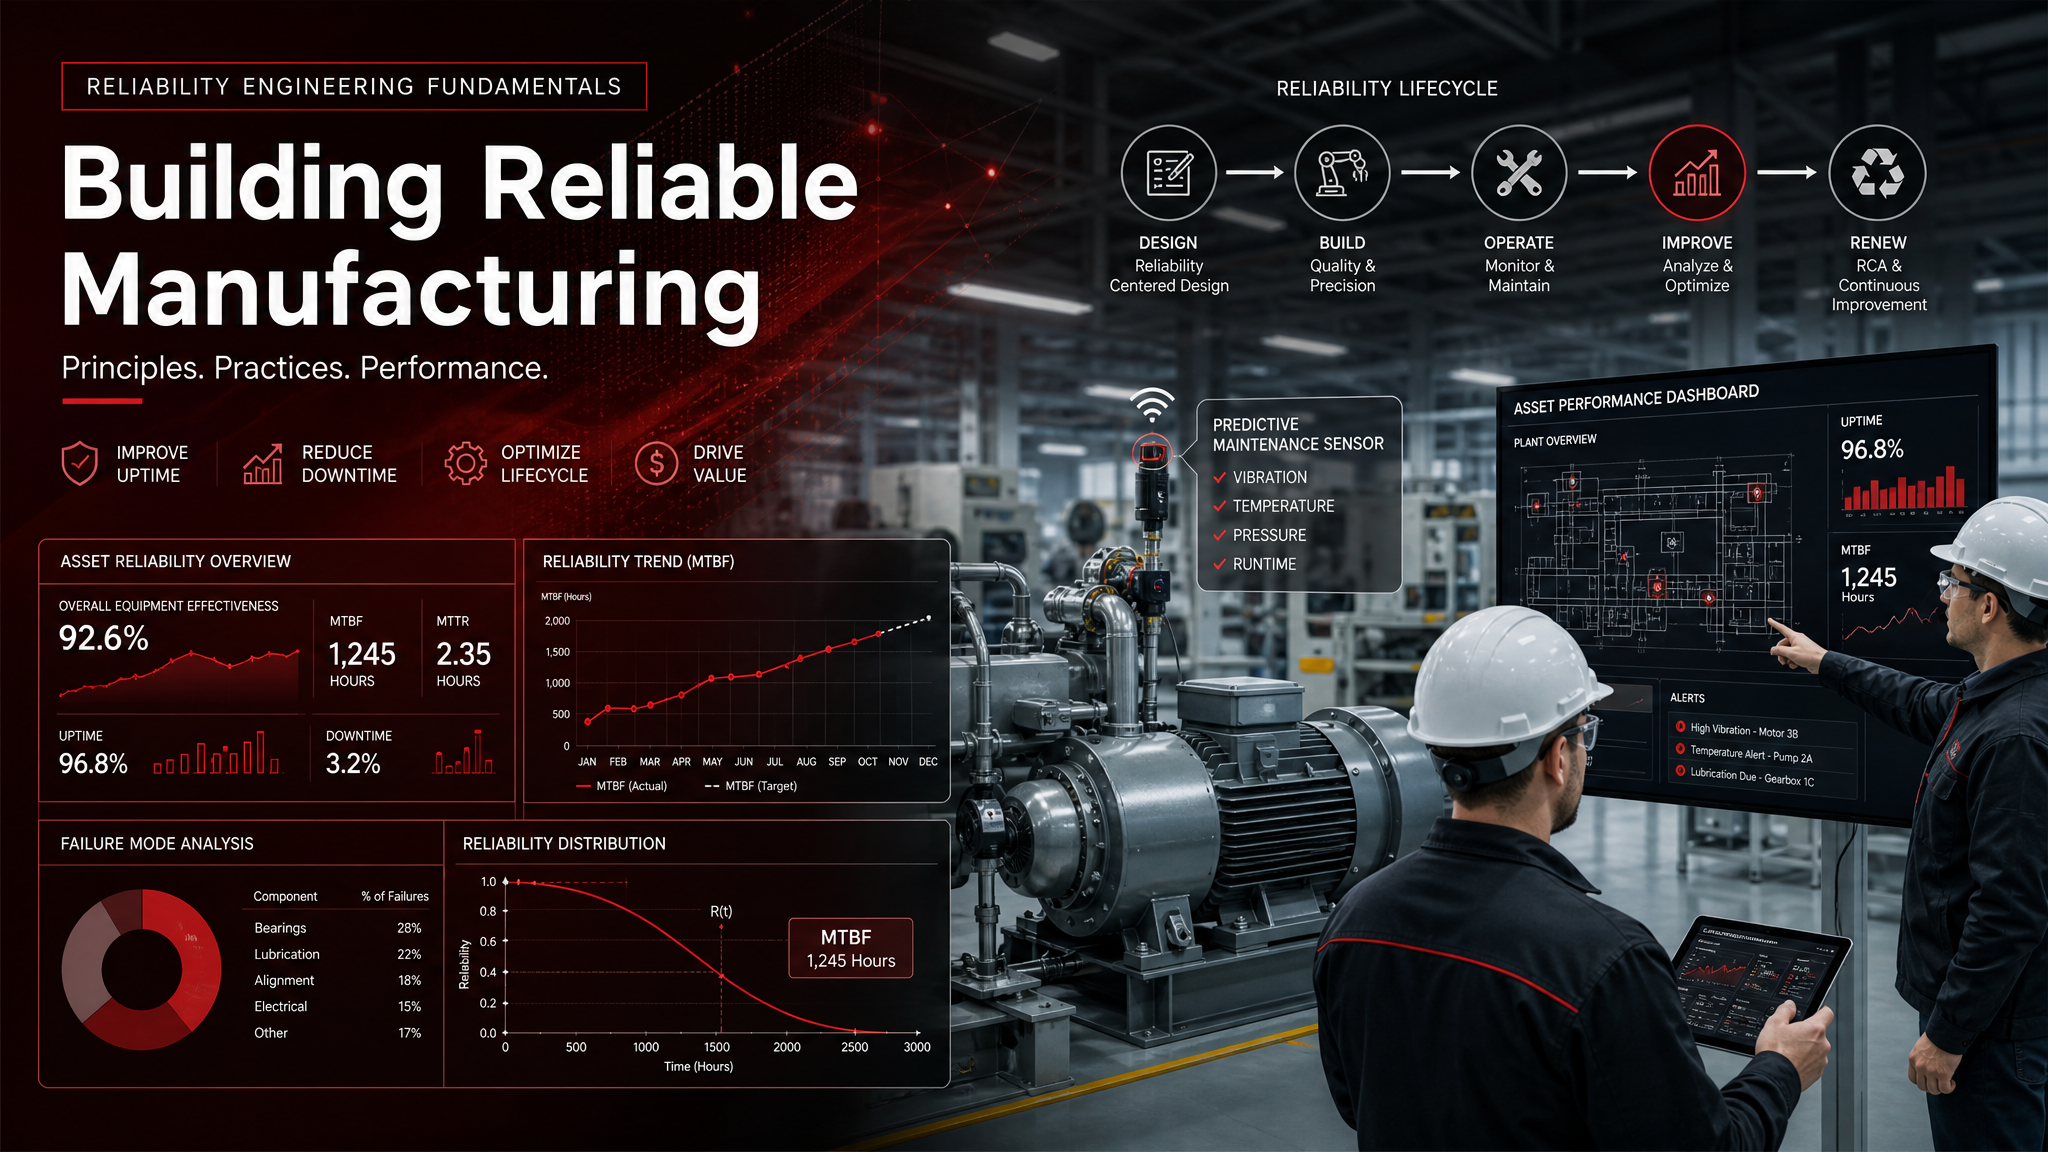
Illustrative image generated using AI; any people depicted are not real individuals.
Every manufacturing plant has two types of equipment problems: the ones you planned for and the ones that wake you up at 2 AM. Reliability engineering is the discipline that shifts the balance from reactive firefighting to proactive management — systematically analyzing how and why assets fail, predicting when failures will occur, and designing maintenance strategies that maximize uptime at the lowest total cost.
The Cost of Unreliability
Before diving into methodologies, it is worth understanding what is at stake. According to a 2024 Deloitte study on manufacturing downtime, the average cost of unplanned downtime across industrial sectors is approximately $260,000 per hour. For automotive assembly plants, a single hour of line stoppage can exceed $1 million when you factor in lost production, idle labor, expedited shipping, overtime recovery, and potential customer penalties.
But direct downtime cost is only part of the picture. Unreliable equipment also drives:
- Quality defects: Equipment operating in degraded condition produces parts with higher variation, increasing scrap and rework rates
- Safety incidents: Unexpected equipment failures create hazardous conditions for operators
- Excess inventory: Plants with unreliable equipment carry buffer stock to protect against production disruptions
- Customer dissatisfaction: Delivery failures driven by equipment downtime erode customer confidence and can result in lost business
Core Reliability Metrics
Effective reliability programs are built on quantitative measurement. The four foundational metrics every reliability program should track are:
MTBF — Mean Time Between Failures
MTBF measures the average operating time a system runs before experiencing a failure. A higher MTBF indicates a more reliable asset. For repairable systems, MTBF = Total Operating Hours ÷ Number of Failures. Critical note: MTBF is only meaningful for the useful-life period of an asset — the flat bottom of the bathtub curve. During infant mortality or wear-out phases, MTBF is misleading because the failure rate is not constant.
MTTR — Mean Time To Repair
MTTR measures how quickly a failed asset is restored to operation. A lower MTTR indicates a more maintainable asset and a more responsive maintenance organization. MTTR includes diagnosis time, parts procurement, actual repair work, and testing/restart time. Reducing MTTR often requires investment in spare parts strategy, maintenance training, and standardized repair procedures.
Availability
Availability combines MTBF and MTTR into a single percentage: Availability = MTBF ÷ (MTBF + MTTR). An asset with MTBF of 2,000 hours and MTTR of 4 hours has availability of 99.8%. This metric is the one most visible to operations leadership because it directly translates to productive capacity.
Failure Rate
The failure rate (λ) is the inverse of MTBF: λ = 1 ÷ MTBF. It represents the number of expected failures per unit of time and is used in probabilistic reliability calculations. For the CNC machine with MTBF of 2,000 hours, the failure rate is 0.0005 failures per hour, or approximately one failure every 2,000 operating hours.
The Four Pillars of Reliability Engineering
A mature reliability engineering program rests on four interconnected disciplines:
1. FRACAS — Failure Reporting, Analysis, and Corrective Action System
FRACAS is the closed-loop system for capturing failure data, analyzing root causes, implementing corrective actions, and verifying effectiveness. Without FRACAS, an organization has no systematic way to learn from failures. Every failure is treated as a unique event rather than a data point in a pattern. FRACAS transforms individual failures into organizational intelligence.
2. Weibull Analysis
Weibull analysis is the statistical method used to model equipment life and predict failure behavior. By fitting time-to-failure data to the Weibull distribution, reliability engineers can determine the failure pattern (infant mortality, random, or wear-out), estimate the characteristic life of components, and calculate the probability of failure at any point in time. This information drives maintenance interval decisions — should you replace a bearing every 5,000 hours or 8,000 hours? Weibull analysis gives you the data to answer that question.
3. RCM — Reliability-Centered Maintenance
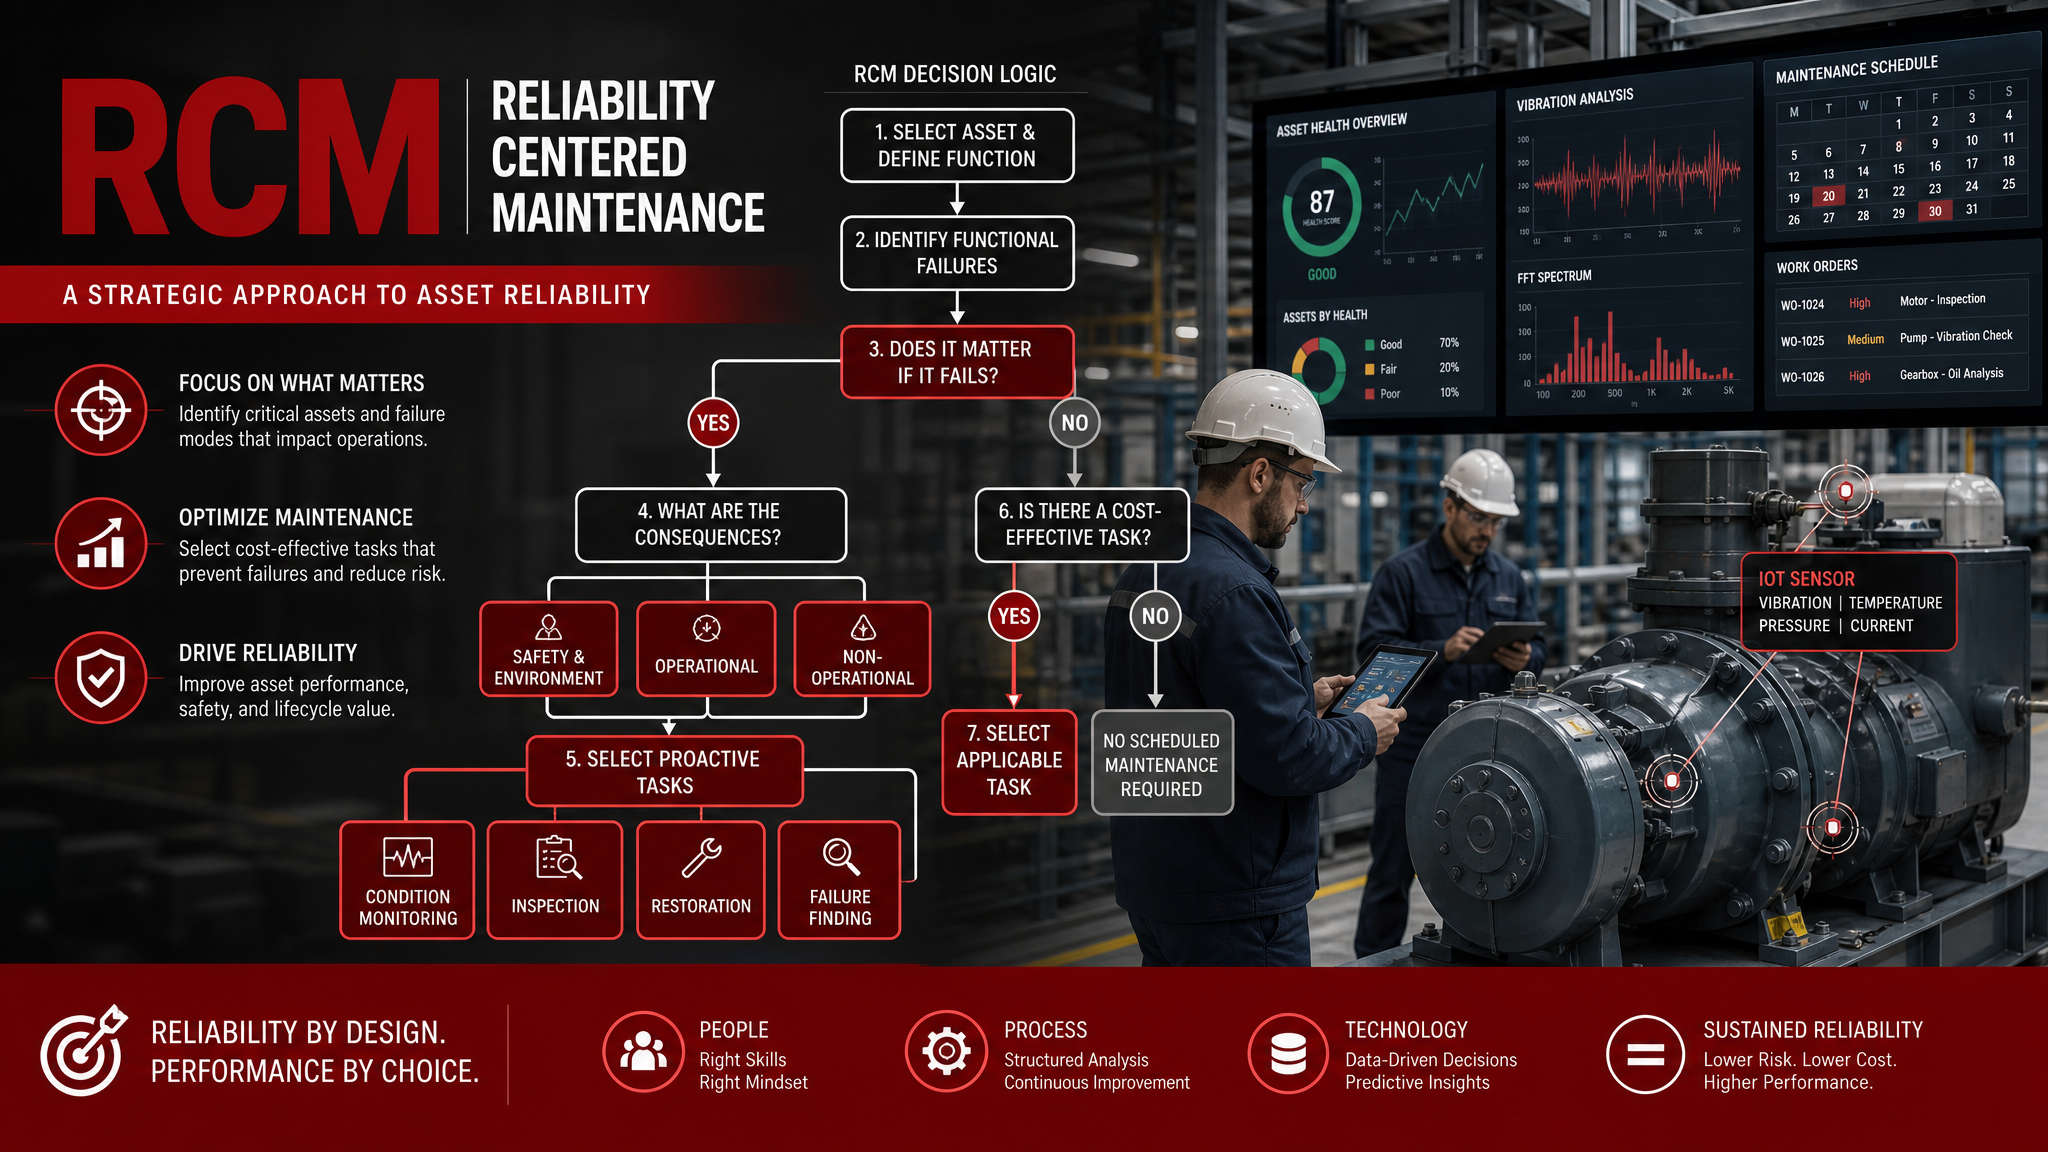
RCM is a structured methodology for determining the maintenance requirements of physical assets in their operating context. Instead of applying the same maintenance strategy to every asset, RCM analyzes the functions of each asset, identifies how those functions can fail, evaluates the consequences of failure, and selects the most appropriate maintenance task — condition-based, time-based, failure-finding, or run-to-failure. The result is a maintenance program that allocates resources where they deliver the most value.
4. Asset Health Management
Asset health management integrates data from multiple sources — FRACAS records, condition monitoring sensors, maintenance history, operational parameters — into a comprehensive view of each asset's current condition and predicted remaining useful life. Modern systems use artificial intelligence to analyze these data streams and generate health scores, risk assessments, and maintenance recommendations. This is the frontier of reliability engineering, and it is where the discipline is evolving most rapidly.
The Bathtub Curve: Understanding Failure Patterns
The bathtub curve is the foundational model in reliability engineering. It describes the three phases of equipment life:
- Infant Mortality (Decreasing Failure Rate): Early failures caused by manufacturing defects, installation errors, or design weaknesses. These are addressed through burn-in testing, commissioning procedures, and design reviews.
- Useful Life (Constant Failure Rate): The normal operating period where failures occur at a roughly constant, random rate. These failures are best addressed through condition monitoring and corrective maintenance.
- Wear-Out (Increasing Failure Rate): End-of-life failures caused by fatigue, corrosion, erosion, and material degradation. These are addressed through time-based replacement strategies informed by Weibull analysis.
Understanding which phase an asset population is in — and this is what Weibull analysis reveals — is critical for selecting the right maintenance strategy. Applying time-based replacement to assets in the useful-life phase wastes money. Applying run-to-failure to assets in the wear-out phase invites catastrophic failures.
Building a Reliability Program from Scratch
For organizations starting from zero, the reliability journey follows a predictable progression:
- Establish criticality rankings: Classify every asset as A (critical — failure stops production), B (important — failure degrades production), or C (general — failure has minimal immediate impact). This prioritizes where to focus reliability efforts.
- Implement FRACAS: Start capturing every failure with standardized data: asset ID, failure mode, failure mechanism, root cause, downtime duration, repair cost, and corrective action. You cannot improve what you do not measure.
- Analyze failure data: Once you have 6 to 12 months of FRACAS data, use Weibull analysis to identify failure patterns and establish replacement intervals for wear-out components.
- Conduct RCM analysis: For critical assets, perform formal RCM analysis to optimize the maintenance strategy — replacing blanket preventive maintenance with targeted, data-driven tasks.
- Deploy condition monitoring: Install sensors on critical assets to enable predictive maintenance based on actual equipment condition rather than calendar or run-time intervals.
- Leverage AI for asset health: As data matures, use AI-powered analytics to synthesize condition data, failure history, and operational parameters into predictive health scores and automated maintenance recommendations.
The Integration with Quality Management
Reliability engineering and quality management are two sides of the same coin. Unreliable equipment produces unreliable quality. When a machine operates in a degraded state — excessive vibration, worn tooling, misaligned fixtures — the process capability deteriorates and defect rates increase. Integrating reliability data into your QMS provides a powerful early warning system: rising failure rates on a critical asset should trigger quality alerts before the defects reach the customer.
The most effective organizations manage reliability and quality in a unified system, with shared data, shared metrics, and shared accountability for operational performance.
Frequently Asked Questions
What is reliability engineering and why does it matter in manufacturing?
What are MTBF and MTTR and how are they calculated?
What is the difference between reliability engineering and predictive maintenance?
About the Author
John Lee
Founder & Quality Systems Architect
John Lee brings over 20 years of hands-on experience in quality management across automotive, aerospace, and medical device manufacturing. As the founder of IntelligentQMS, he has helped organizations worldwide implement robust quality management systems that drive operational excellence.
Related Articles
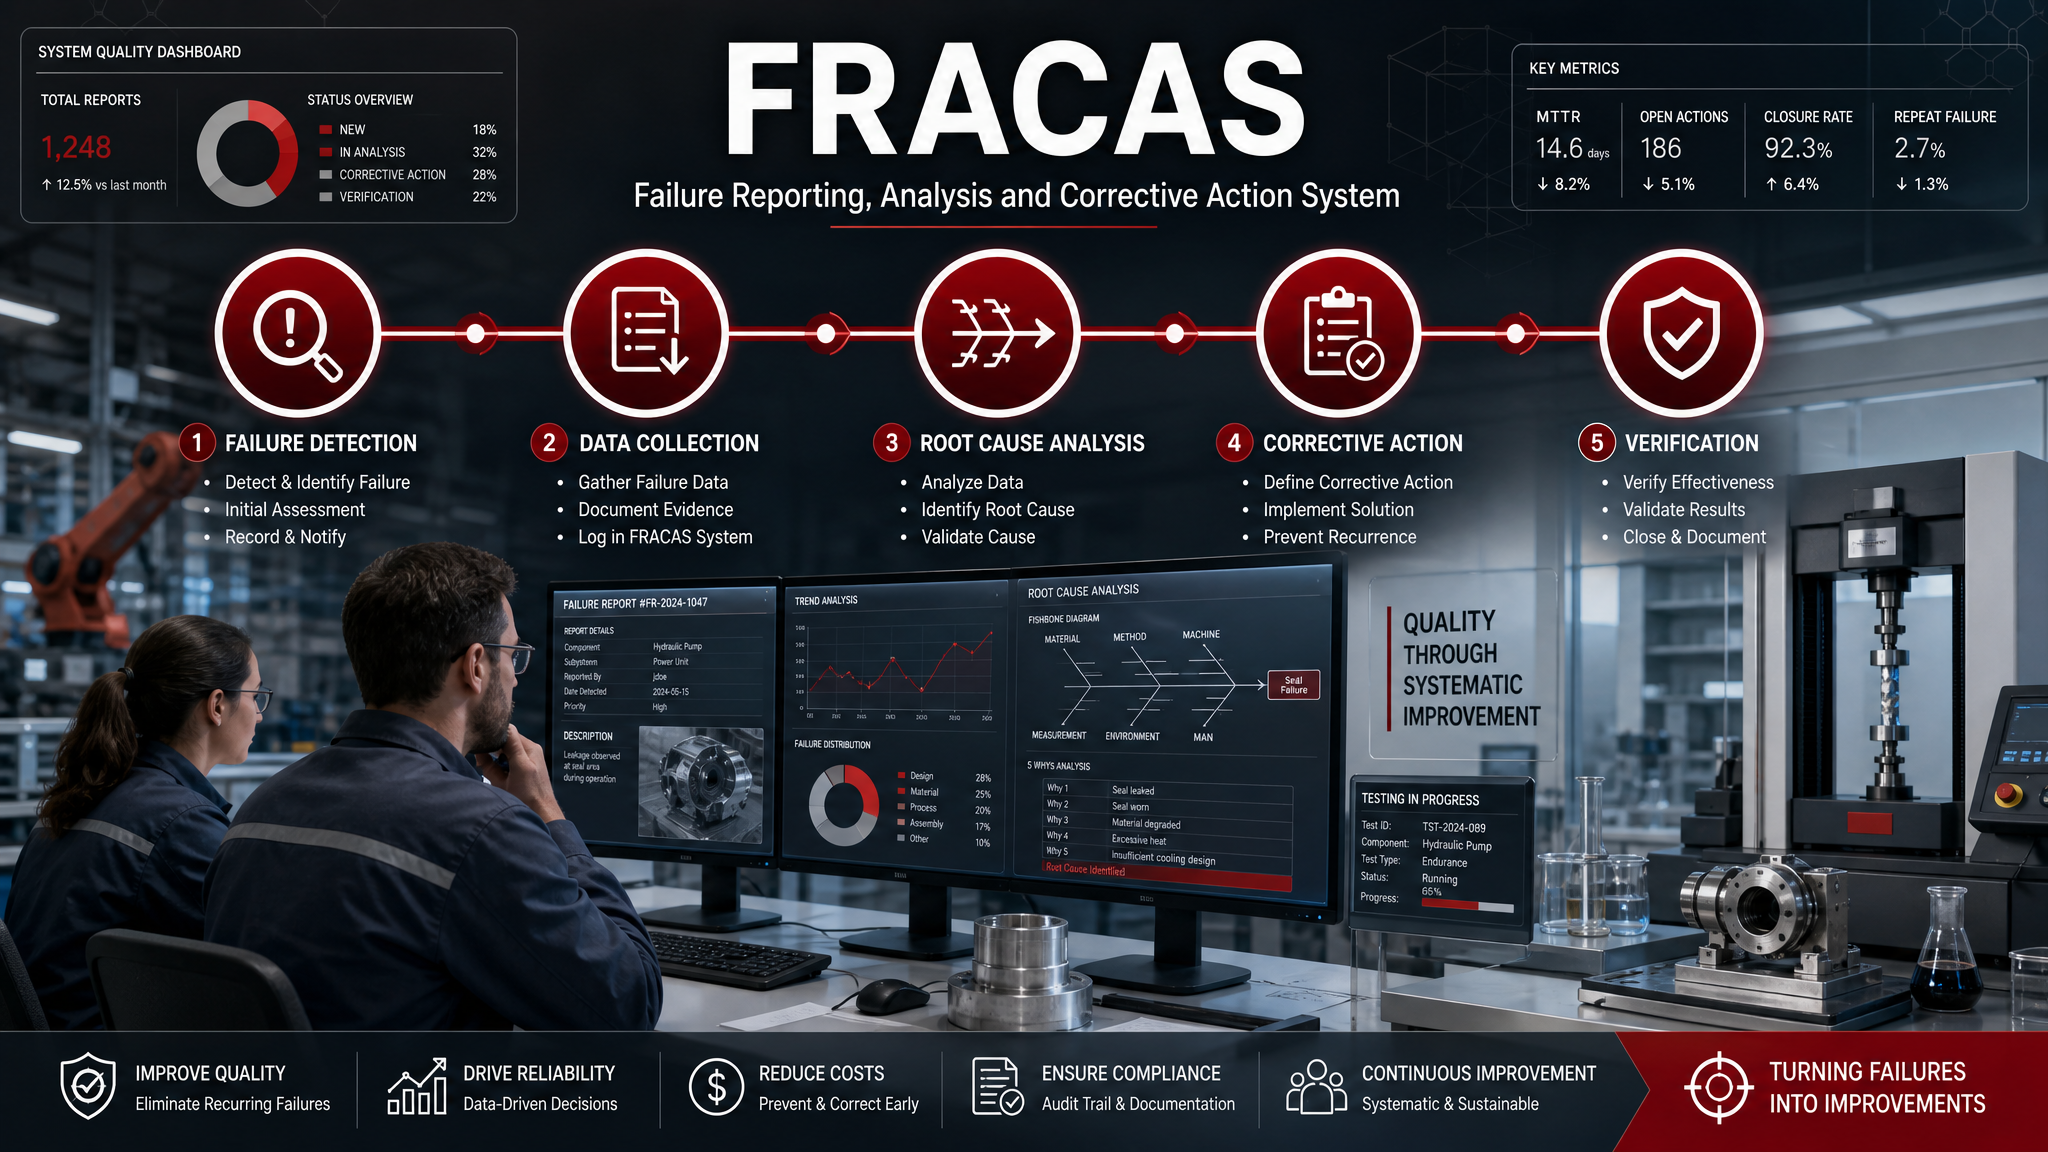
FRACAS Explained: How to Build a Failure Reporting, Analysis, and Corrective Action System That Drives Reliability Improvement

Weibull Analysis for Reliability Engineers: How to Predict Equipment Life, Optimize Replacement Intervals, and Interpret Failure Data