FRACAS Explained: How to Build a Failure Reporting, Analysis, and Corrective Action System That Drives Reliability Improvement
A practical guide to implementing FRACAS in manufacturing — covering failure data capture, root cause analysis workflows, corrective action tracking, and how to turn failure events into organizational learning.
John Lee
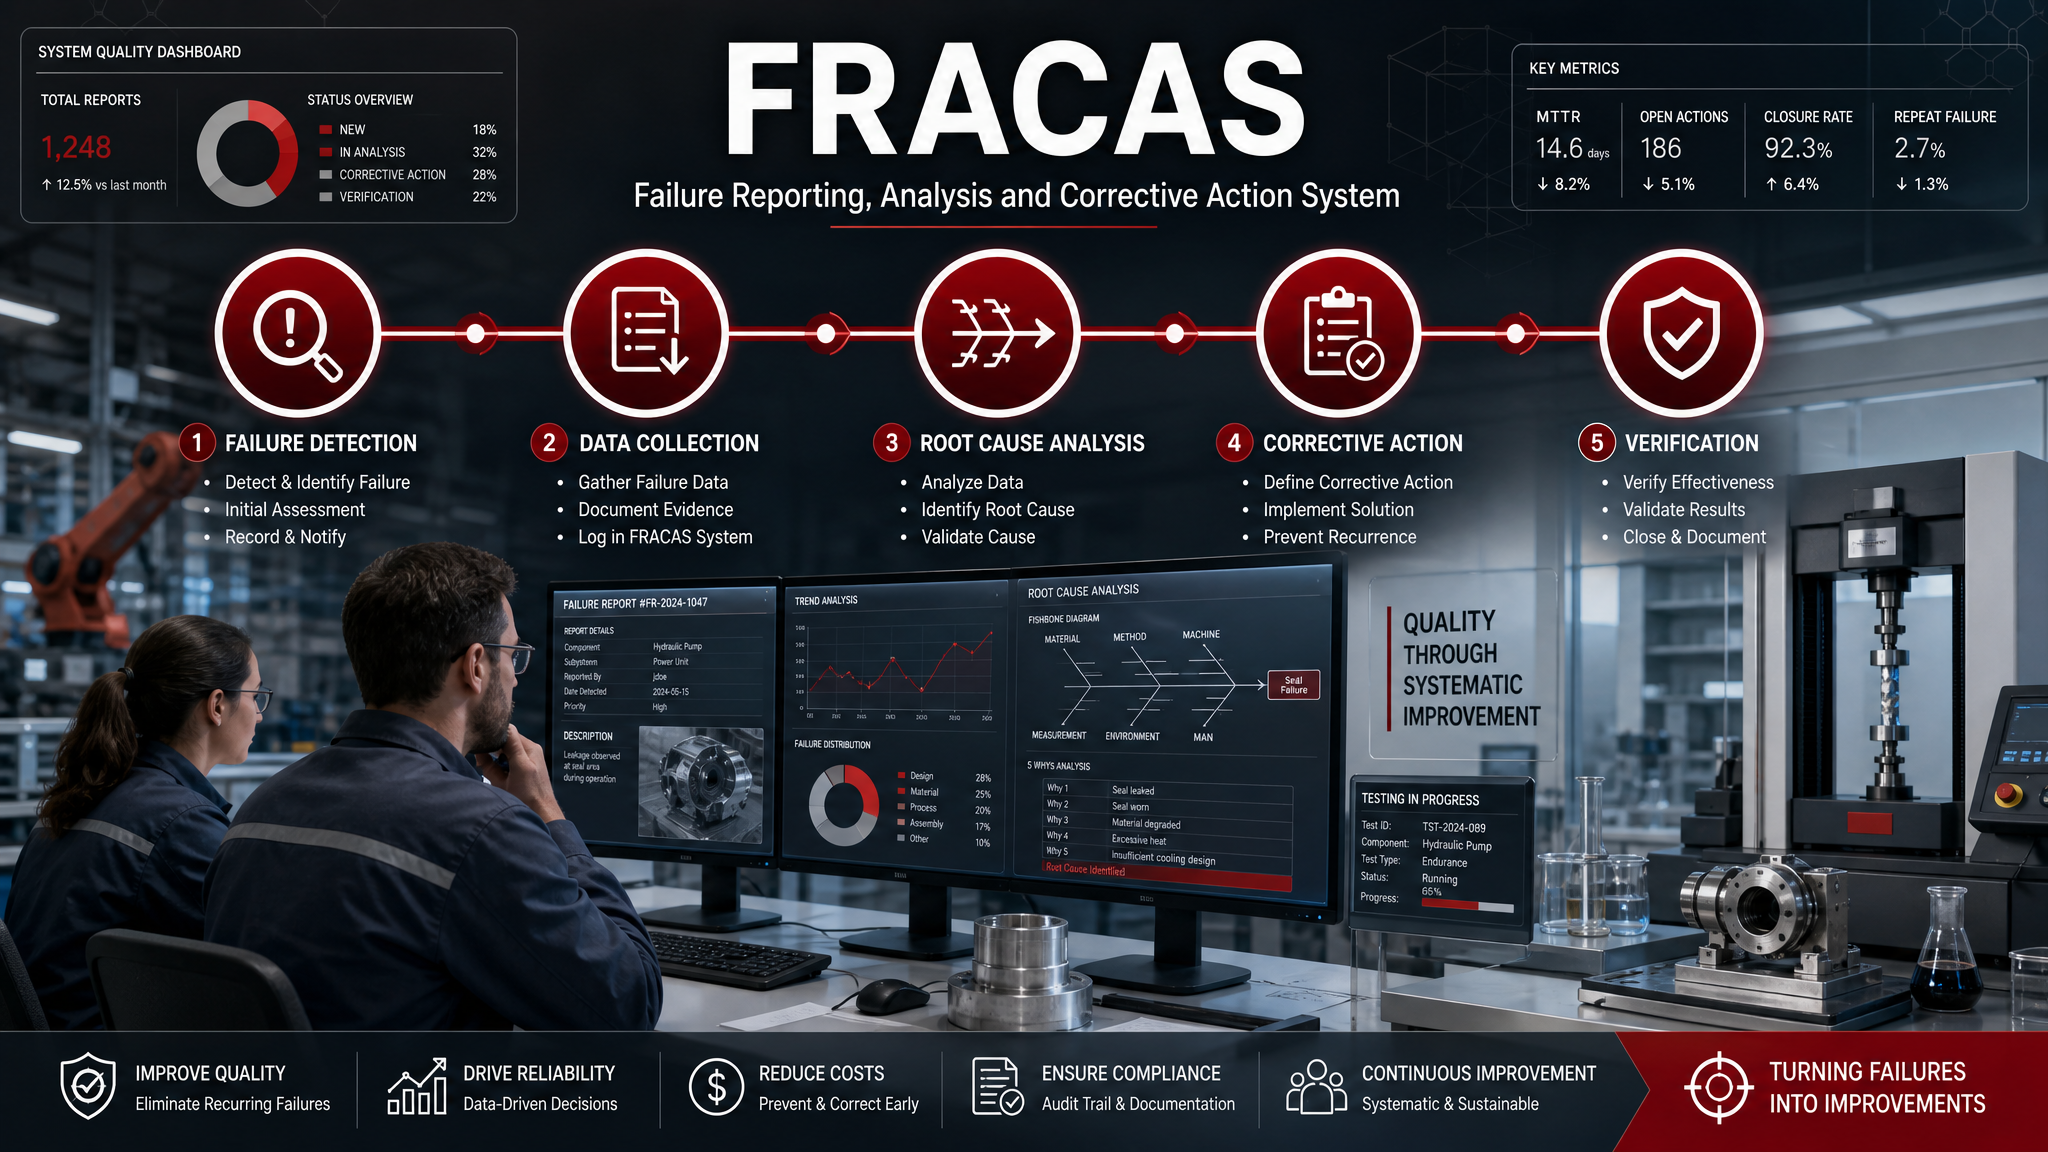
Illustrative image generated using AI; any people depicted are not real individuals.
Every piece of equipment in your plant is telling you a story through its failure history. The question is whether you are listening. FRACAS — Failure Reporting, Analysis, and Corrective Action System — is the discipline of capturing every failure, understanding why it happened, fixing the root cause, and ensuring the fix actually works. It is the foundation upon which every other reliability discipline is built.
Why FRACAS Matters
Without FRACAS, maintenance organizations operate on tribal knowledge and gut feel. The veteran millwright knows that "press 7 always acts up in the summer" and "you have to tap the sensor on line 3 to get it to reset." This knowledge is valuable, but it is unstructured, unshared, and it walks out the door when that millwright retires.
FRACAS converts tribal knowledge into organizational intelligence. It creates a searchable, analyzable database of every failure event, enabling the organization to identify patterns, quantify the cost of unreliability, and make evidence-based decisions about where to invest in reliability improvement.
Military and aerospace organizations have used FRACAS since the 1960s — standards like MIL-STD-2155 and MIL-HDBK-781 formalized the discipline. Today, FRACAS is equally essential in commercial manufacturing, where the cost of unplanned downtime makes systematic failure management a competitive necessity.
The Three Stages of FRACAS
Stage 1: Failure Reporting
Failure reporting is the data capture stage. When an asset fails or degrades below acceptable performance, a failure report is created. The report must capture enough data to support root cause analysis and statistical trending. Key fields include:
- Asset identification: Which specific asset failed (by ID, not just type)
- Failure mode: What happened — the observable symptom (e.g., "motor overheated," "hydraulic leak at cylinder seal," "control fault code E-47")
- Failure mechanism: Why it happened at the physical level (e.g., "bearing wear," "seal degradation," "electrical short")
- Severity: The impact of the failure (critical = production stopped, major = production degraded, minor = no immediate production impact)
- Downtime: Hours from failure detection to return to service
- Cost: Parts, labor, and estimated production loss
The most common failure of FRACAS implementation is making the reporting form too long or too complicated. Maintenance technicians are busy. If the form takes 20 minutes to fill out, it will not get filled out. Target a 3-to-5-minute reporting process with dropdown menus for failure modes and mechanisms, and reserve free-text fields for the root cause narrative.
Stage 2: Analysis
The analysis stage applies root cause analysis techniques to the failure data. For individual high-severity failures, this means a formal investigation using tools like:
- 5-Why Analysis: Iteratively asking "why" to drill from symptom to root cause
- Fishbone (Ishikawa) Diagram: Organizing potential causes into categories (Machine, Method, Material, Man, Measurement, Environment)
- Fault Tree Analysis: Mapping the logical relationships between events that lead to the top-level failure
For aggregate analysis, reliability engineers review failure trends across the fleet:
- Which assets have the highest failure frequency?
- What are the most common failure modes?
- Are failure rates increasing, stable, or decreasing?
- Are there seasonal or operational patterns?
- Which failures cost the most in downtime and repair?
This aggregate analysis is where FRACAS delivers its greatest value — individual failures are often unpredictable, but patterns in failure data are actionable.
Stage 3: Corrective Action
The corrective action stage closes the loop by implementing solutions and verifying their effectiveness:
- Immediate containment: What was done to restore the asset to operation? (This is typically already complete by the time the analysis begins.)
- Root cause elimination: What permanent corrective action will prevent recurrence? This could be a design change, a revised maintenance procedure, a parts specification change, or an operational parameter adjustment.
- Verification: How will the organization confirm the corrective action is effective? This should be measurable — monitor the asset for a defined period and confirm the specific failure mode has not recurred.
- Fleet-wide applicability: Does the corrective action apply to other similar assets? If bearing type X failed on press 7 due to misalignment, should presses 1 through 6 be inspected as well?
FRACAS Data as the Foundation for Reliability Analysis
FRACAS data feeds directly into higher-level reliability disciplines:
- MTBF/MTTR calculations: Computed directly from FRACAS time-stamped failure and repair records
- Weibull analysis: Time-to-failure data from FRACAS provides the input for Weibull life modeling
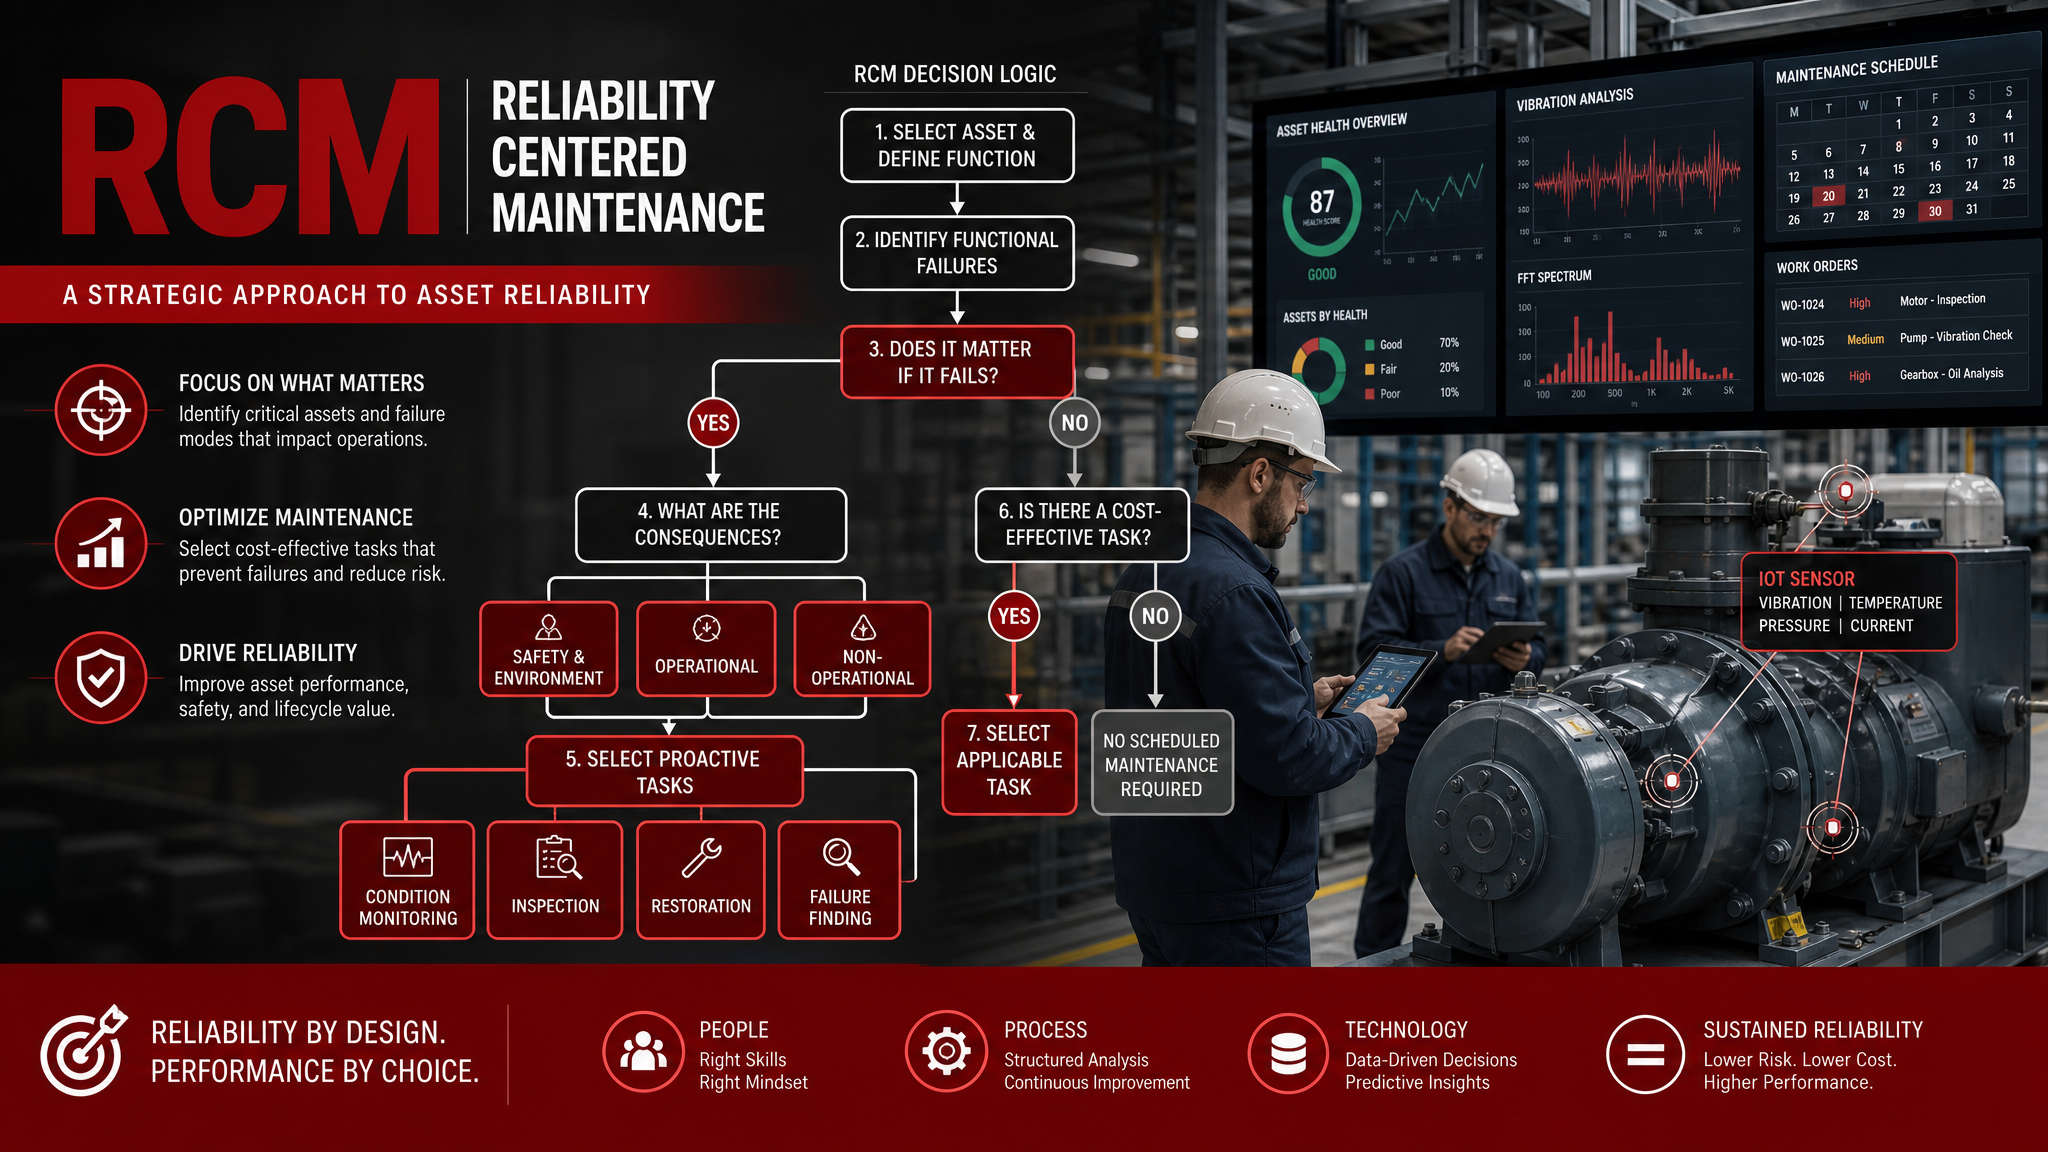
- RCM analysis: FRACAS failure modes and consequences inform the RCM decision logic
- Maintenance budget justification: FRACAS cost data provides the evidence base for capital investment in reliability improvement
AI-Powered FRACAS Analysis
Modern reliability platforms are applying artificial intelligence to FRACAS data to surface insights that would take human analysts weeks to identify:
- Automated pattern recognition: AI identifies clusters of related failures across different assets, shifts, or operating conditions
- Predictive failure alerts: Machine learning models trained on FRACAS data predict which assets are approaching failure based on their failure history trajectory
- Root cause suggestion: AI compares new failure reports against the historical database and suggests likely root causes based on similar past events
- Corrective action effectiveness scoring: AI tracks whether implemented corrective actions actually reduced the recurrence of specific failure modes
Implementation Best Practices
- Start with critical assets: Do not try to implement FRACAS plant-wide on day one. Begin with your A-criticality assets and expand as the process matures.
- Standardize failure mode taxonomy: Create a controlled list of failure modes and mechanisms. Free-text-only reporting creates data that is impossible to analyze statistically.
- Close the loop: A FRACAS system that captures data but never drives corrective action is a filing cabinet, not a management system. Assign ownership and due dates for every corrective action, and track closure rates.
- Review regularly: Monthly FRACAS review meetings — attended by maintenance, reliability, and operations leadership — are essential for turning data into action.
- Celebrate the data: Maintenance teams that report failures are creating organizational value, not admitting defeat. Recognize and reward thorough failure reporting.
Frequently Asked Questions
What is FRACAS and how does it work in manufacturing?
What data fields should a FRACAS failure report capture?
How does FRACAS differ from a corrective action system like 8D?
About the Author
John Lee
Founder & Quality Systems Architect
John Lee brings over 20 years of hands-on experience in quality management across automotive, aerospace, and medical device manufacturing. As the founder of IntelligentQMS, he has helped organizations worldwide implement robust quality management systems that drive operational excellence.
Related Articles
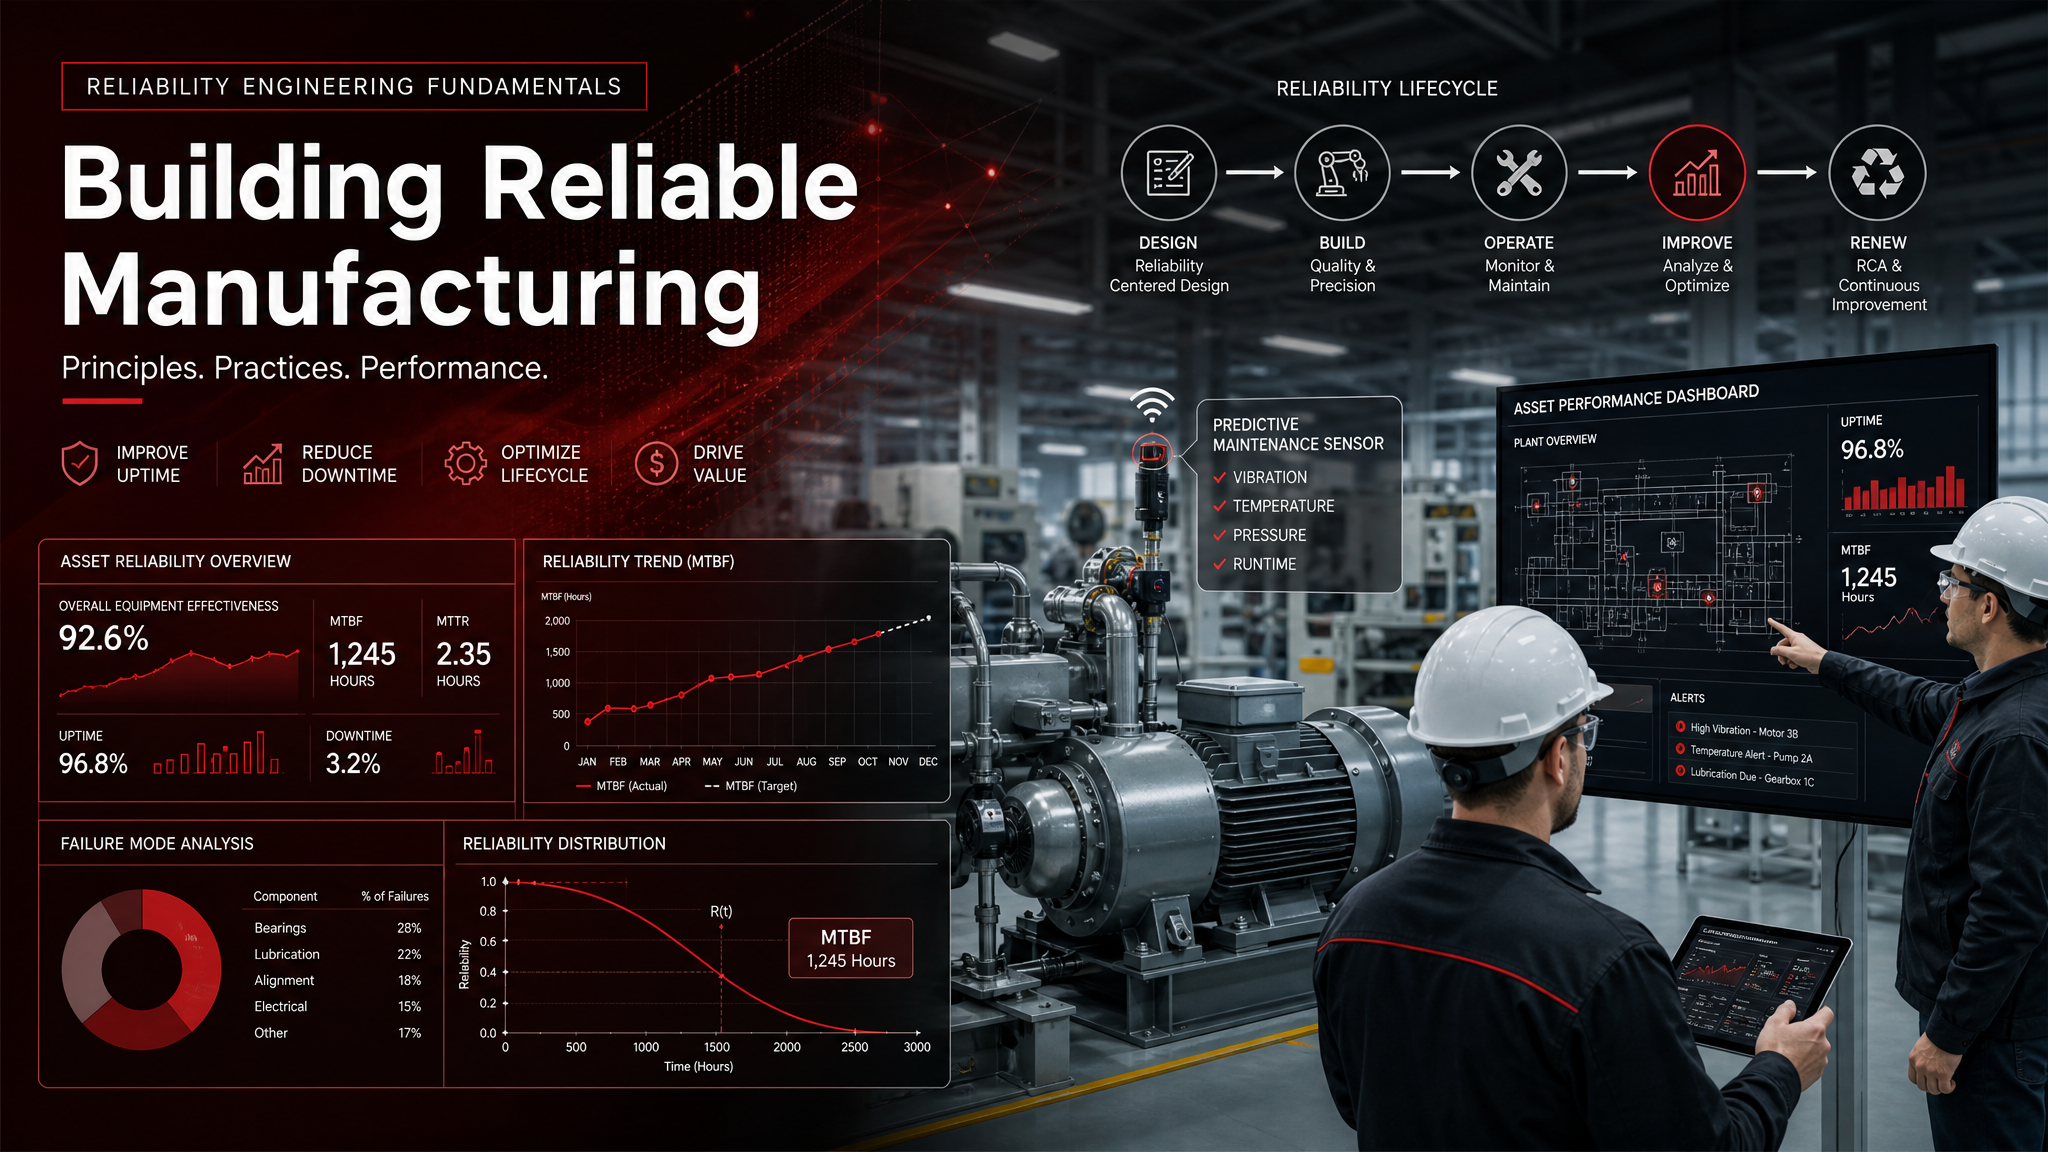
Reliability Engineering in Manufacturing: The Complete Guide to Maximizing Asset Uptime and Reducing Unplanned Failures
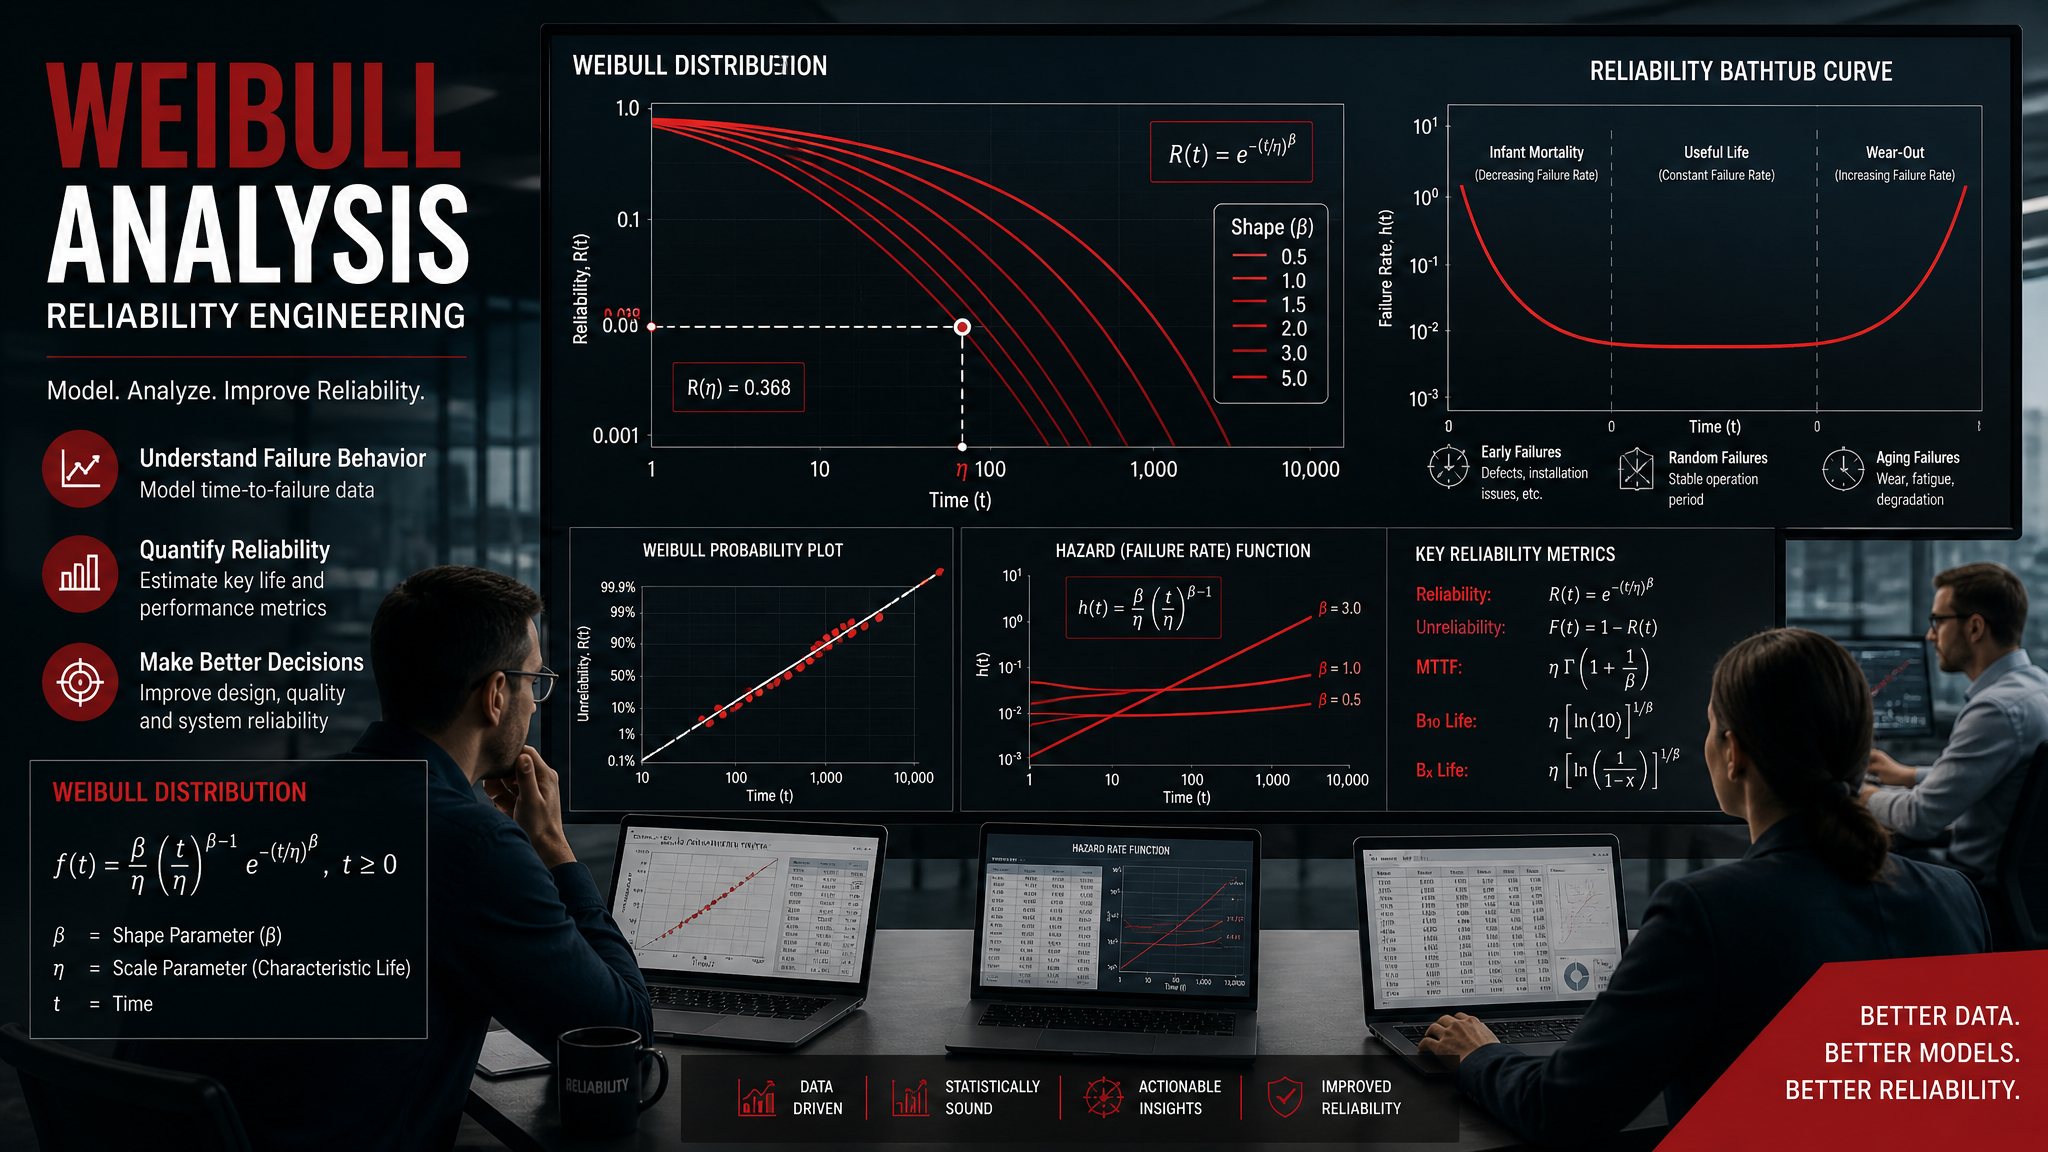
Weibull Analysis for Reliability Engineers: How to Predict Equipment Life, Optimize Replacement Intervals, and Interpret Failure Data